|
|
|
|
|
Name
Cash Bids
Market Data
News
Ag Commentary
Weather
Resources
|

Why I Follow Unusual Options Flow — A DXCM Case Study
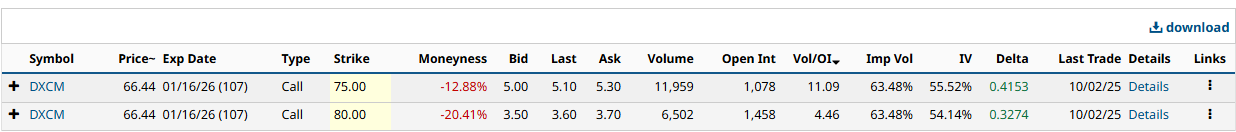
If you know me as @OptionsButterflyQueen, you know I do not chase headlines. I watch the tape, I follow flow, and I build trades with defined risk. Flow tells me where the smart money is leaning. My structures — butterflies, spreads, broken wings — let me capture that move without gambling. What Unusual Options Activity MeansBarchart flags unusual activity when volume explodes relative to open interest. That means new money, not just rolling or hedging. What the DXCM Tape Is SayingToday I noticed unusual call options activity in DXCM. 1. Big Calls Hit the TapeOn Barchart’s Options Flow, I saw heavy call buying in Jan 2026 75C. That is not retail noise. That is a directional bet. When I see that, I pay attention.
 2. Gamma Map = Volatility ZoneNext stop: Gamma Exposure. The gamma flip is ~71.70. DXCM trades below at ~66.44. Below the flip, dealers are short gamma. That means they chase price — selling into weakness, buying into strength — and that amplifies moves. 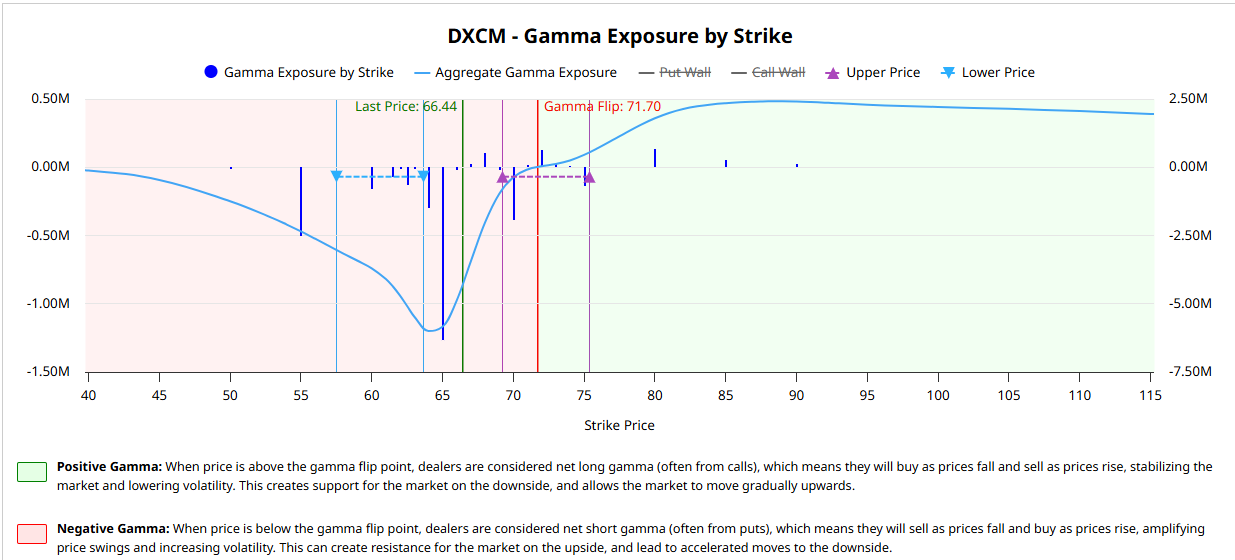
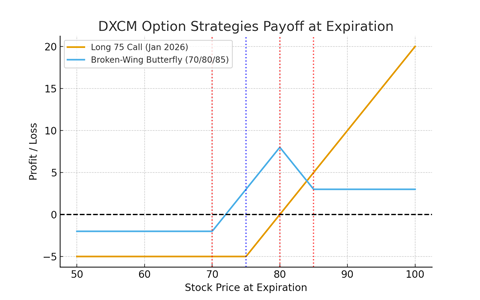
3. Skew & Max Pain Create a RangeOn the Volatility Skew chart, far OTM calls are more expensive. The market is pricing upside risk. On Max Pain, the clustering is between 68–72. That is where option sellers prefer to pin the stock at expiration. Think of it as gravity. 📊 Placeholder: Insert Screenshot 5 - DXCM Max Pain Chart 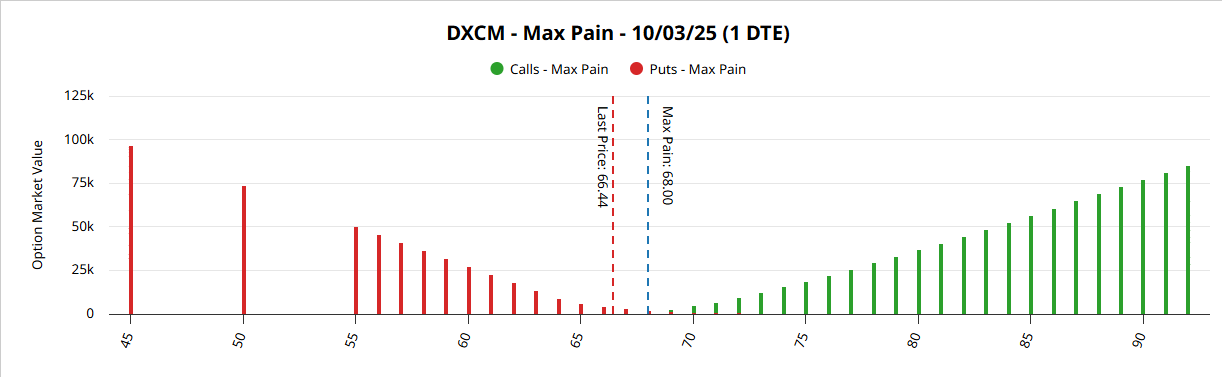 How I Turn Flow Into a Trade- Validate Flow: Jan 2026 75C call buying is real. Payoff DiagramsTo make it clear, here is what the payoff looks like at expiration:
- Orange line = Long Jan 2026 75 Call (unusual flow trade). Closing ThoughtsUnusual options flow is not magic. It is not always right. But it is early information. DXCM’s tape is alive right now — with big calls, amplified volatility under the gamma flip, and a max pain zone that could pull price higher. This article contains syndicated content. We have not reviewed, approved, or endorsed the content, and may receive compensation for placement of the content on this site. For more information please view the Barchart Disclosure Policy here.
|
|
|